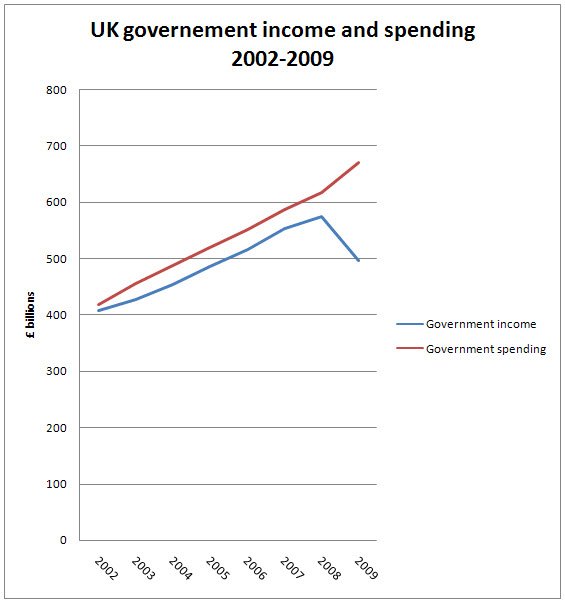
This graph shows the forecast totals for government income and spending from each of the least seven year’s budgets (source HM Treasury web site):
When preparing it I noticed something peculiar, so I prepared a second version that showed the income of one year compared with income of the previous year. I did this because spend takes place in real time — taxable income is received after the economic events that give rise to it being due. OK, I accept not always one year later (but sometimes so) and so removing the time lag seemed credible to represent tax spend against income accrued. This resulted:
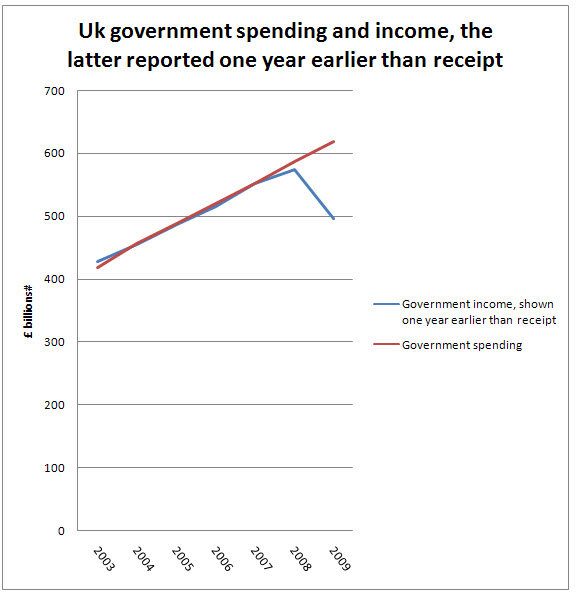
The data is remarkable: from 2002 to 2008 if the lag on receipts is removed then the difference between income and expenditure over the whole period is £6bn — or 0.2% of total income for the six year period.
In other words there was little or no borrowing problem — just an income timing problem.
Nor was there excessive spending — it was funded on an accruals basis — near enough. Until 2009 — when it is not spending that is excessive, but the fact that income falls off a cliff that is the problem.
So, look at this realistically. This says the problems in funding are:
a) How to bring forward the timing of as many tax receipts as possible;
b) How to restore tax income.
What has spending got to do with it?
Thanks for reading this post.
You can share this post on social media of your choice by clicking these icons:
You can subscribe to this blog's daily email here.
And if you would like to support this blog you can, here:


I notice that government spending is 66% higher in 2009 than in 2003. Are public services really 66% better today than they were six years ago? Of course not. This graph tells me we could cut public spending by £200bn and return to 2003 levels of public services – and I suspect 99.99% of us wouldn’t notice a jot of difference.
Peter
Tell that to those who haven’t had to wait for surgery
To those with a new school
To those at university
To those with a job
To those with a bank account (still – only thanks to the state)
To those who are better off from the minimum wage, sure start and more
To those with apprenticeships
I could go on
Labour has got a lot wrong and I am not a party member
But your analysis is straightforward bigotry
The reality is real progress
And stability
The Tories could not have delivered either
Richard
That’s as may be but Britain doesn’t look good when one steps ashore here. The “public realm” is dreadful compared to other countries in North West Europe. And that is what shapes perceptions, not the things on your list (which I am not suggesting are trivial).
Richard,
Great. You can reel off lists. But to claim a 66% increase in the quality of public services since 2003 is a straightforward lie.
Which you are rather good at.
Richard doesn’t have to show a 66% increase in the qulity of public services. Inflation accounts for a significant chunk of this 66%. How much, I am not sure, should wage inflation or CPI be the measure?
22% is inflation
There was an increase in real spending – but not enough
Richard
Ah, wonderful – there wasn’t enough spending! If only government spending had been a little bit higher and then we’d be drowning in an even bigger sea of debt than we are in the moment! I’ll grant you inflation (although I assumed the graph was in real terms), but it’s still a monumental increase.
Really, I despair Richard…
Richard
We’ve clashed before, so I expect a robust response!!!
If we are to accept your analysis, then does it not raise a issue withregards to all the tax avoiders that have been avoiding UK tax!! If there is a time lag, as your graph shows, what’s the problem?
Oh good heaven’s above – haven’t you considered the possibility that if they paid up those who are tax compiant could pay less?
Richard
Buy surely the tax compliant (please note the spelling here. I shouldn’t be so provocative, but you picked me up on a previous post!!!) are paying the right amount of tax already or have you just redefined how to be tax compliant! 🙂
It does show that our government didn’t do what every other govenment has done in the past though. They didn’t put anything away during the good times to use when the storm clouds gathered!!!
Richard
I tried not to be rude last time. i will be this time.
Of course they’re tax compliant now but if, say £30 bill;ion was picked up from abusers that could be used to cut this income tax rate – so they would be compliant and better off then
Is such a basic mathematical analysis beyond you?
And before you comment on debt note that what you’re saying is utter nonsense – look at the facts and then see why I say so – don’t jst mimick Osborne who is in as much denial in this as Cameron is on the fact that he’s an ally of neo-Nazis
Richard
I won’t comment on debt! I just wanted to see if I could pull your chain and it looks like I’ve succeeded!!
where can i find Actual govt income figures, what comes in from what area ie fuel tax etc and also the same for expenditure, what it is spent on and in waht areas.
thanks
Kevin
HM Treasury Budget web site
Richard
“The reality is real progress
And stability”
Are you for real?
Peter
What is the reality then?
Come on.
I’ll time you….one….
I never will understand why some people resort to attacking fast-tyhpe errors in discourse where fact ranks a higher than strength of prose.
that can be done after
So sreiously, ididn’t mean that one, and i always try and editr except this time. and sewe?
rubbish. dark room.
now go and be clever.
Hi Richard,
Can you tell me which part of the Hm Treasury website you got this graph from? I need the figures rather than the graph and can’t seem to find the graph to get them.
Thanks
Emily
Emily
I did the research based on budget statements for each year
email me at richard.murphy@taxresearch.org.uk and I’ll send the data
Richard