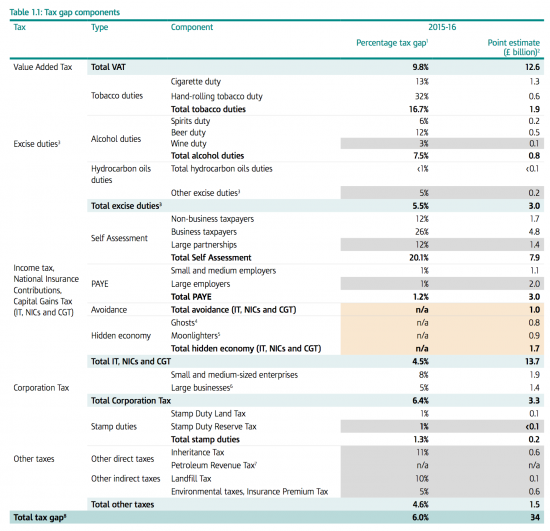
It has not taken me long to have my usual doubts about HMRC's latest annual report on the tax gap. This is their summary of its latest composition:
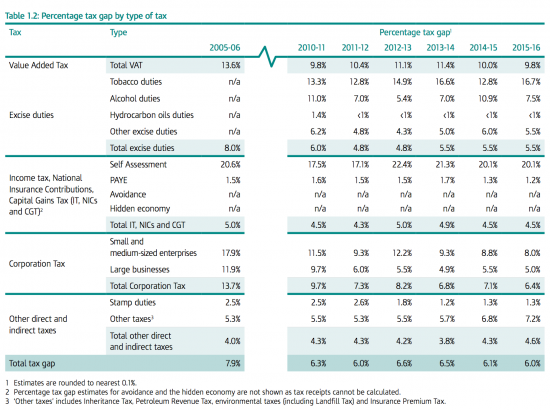
This is translated into summary data over time as follows:
First, let me be very clear that the last table is written with the benefit of hindsight. As HMRC themselves admit, most of the improvements in their tax gap estimates over time have arisen from revisions to the way in which they estimate the data, as this table shows:
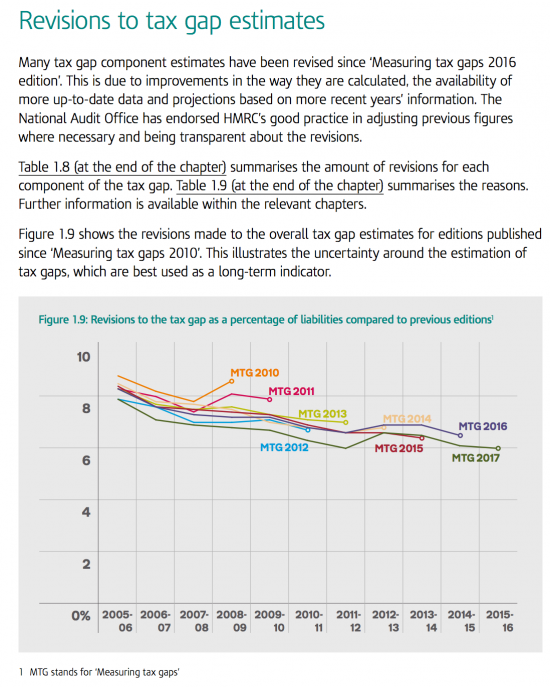
The 2008/09 data has been revised every year since first published. Originally estimated at something well over 8% of total tax liabilities, it is now reported as being almost two percentage points, or in excess of 20% in value terms, less than that (I have not located underlying data to be more precise as yet so am being cautious with estimates). Actual behaviour did not change, of course. Caution is required with all the data HMRC have to offer as a result: if it can include errors of this scale then its reliability has to be questioned.
There are other good reasons for thinking this as well. Look at the data on tax avoidance. According to the latest data there is a loss to this of just £1 billion a year for income tax and national insurance. But this is absurd. We know that national insurance losses from tax driven incorporations alone were apparently costing the government at least £500 million a year by the government's own estimate in 2015 and were sufficient to require action. And of course, there were many other schemes in use. The suggestion that total avoidance was, then, just £1 billion across income tax, NIC and CGT looks to be a hopelessly inaccurate estimate.
Then there is the issue of tax avoidance by large companies. Yesterday Economia magazine (the in house journal of the Institute of Chartered Accountants in England and Wales) reported:
HMRC has increased the number of challenges on large businesses last year, as it suspects £5.8bn was underpaid through transfer pricing
The Revenue believes the amount of tax unpaid by big businesses last year increased 51% since 2015/16, from £3.8bn to £5.8bn.
According to Pinsent Masons, this rise was driven by an increase in diverted profits tax (DPT) inquiries, used to prevent activities that divert profit away from the UK.
And yet large business corporation tax losses, where this is likely to happen, total £1.4 billion. It is simply not possible to reconcile these figures, again.
Next look at the figure for the shadow and hidden economy. Is it really plausible that the tax lost to this is just £1.7 billion out of an economy where GDP is now nearly £2 trillion? The number is simply implausible. If 9.8% of VAT is lost - most to evasion - and VAT is charged on the top line of the nation's income account it is simply not possible that just £1.7 billion is lost to wages in the shadow economy: after all, the VAT fraudulently taken from businesses should be subject to income tax and national insurance. This means that the tax gap has to be understated for this reason.
Finally, note that HMRC make headline news of a 6% under collection rate but tax avoidance and evasion are not included in the estimates of that rate, as indicated by the term n/a. But that is simply not a credible claim then. If HMRC cannot calculate an estimate for these figures then they cannot claim an overall figure because they have no clue what the tax lost is a percentage of.
I would love the UK to have reliable tax gap data. Right now it appears it has not.
Thanks for reading this post.
You can share this post on social media of your choice by clicking these icons:
You can subscribe to this blog's daily email here.
And if you would like to support this blog you can, here:


That figure of 34 Billion never seems to move (+/- a bit). To an un-educated reader like me, it looks like the numbers are manipulated to achieve an outcome that looks about right (to HMRC only). Are there any figures that are credible, it would appear not.
I totally agree with the observations made on HMRC tax gap figures. They don’t make sense at all. Calculating a mean tax gap since 2005-06 it’s at £33bn over the period, in percentage terms standing at 6.6%. I question the importance of this tax gap calculation when the figures themselves don’t make sense when you compare the Cash amount and percentage calculation. As Richard has rightly said why do they revise previous figures every year? This is cheating at its worst. If percentage tax gap has gone down by 0.1 percentage point why did the cash amount increase by £1bn? In 2012-13 year percentage tax gap increased by 0.6 percentage point and yet Cash tax gap went up by £3bn. In the following year 2013-14 percentage tax gap fell by 0.1 percentage point and yet Cash tax gap went up by a further £2bn. What’s going on? These figures are unreliable as they can be seen and will require external review by different experts in the field as there is no way of authenticating these figures. A guess tax gap would be better estimated using forecasting procedures. UK tax gap has been within the boundary of £30bn-£35bn in the last 12 years as such I don’t see any clear methodology of calculating tax gap part from forecasting. Some tax gap calculations are carried forward every year. How can that be possible? We need an independent audit of the methodology used otherwise the publication itself is meaningless. I wish if these statistics were comparable internationally but so far there is no such data available despite HMRC claims that they are the lowest in the world. How do they know?
Look all this handwringing about the ‘ tax gap ‘ isn’t going to change a thing because the trajectory inside HMRC is towards greater and greater computerisation just like it is in big business and if there’s a cost i.e. lack of collection of some tax well that’s just the cost of doing business . Just like PPI – get found out, pay a fine, move on – that’s how it works. If anyone thinks there is going to be some return to the days of human beings operating at a local level connecting to other human beings forget it those days are long gone. This has become an orthodoxy just like that which existed in the medieval church so any other approach will be treated as a heresy and we all know what happened to heretics. If tax is to be ‘ fair ‘ we will have to think about it anew .
I think anew
John Hope,
” if there’s a cost i.e. lack of collection of some tax well that’s just the cost of doing business”
If that is so then it would appear that the business model is too costly. I don’t think that it would survive any credible cost-benefit analysis.
Marco, You may well be right , but you are not running HMRC and neither am I , but it appears to me that those in charge see it that way and have modelled their approach accordingly. The fact is what were once called ‘ public services ‘ have all been modelled in some form or other to appear as though they were businesses. We are ‘ customers ‘ instead of taxpayers, patients, students etc . Again you and I might consider this a fiction, but neoliberal orthodoxy requires that we are all consumers without exception and unless and until some other model appears on the horizon to replace it this is how things will continue whether we are believers, or not.
HMRC is explicitly modelled as if a PLC, from treating taxpayers and benefit claimants as being ‘customers’ to the board structure
And it is wholly inappropriate
[…] than the government had previously forecast. Others believe that even this increased figure is an underestimate. Fortunately, a muscular and courageous international organisation is prepared to step in where […]
[…] than the government had previously forecast. Others believe that even this increased figure is an underestimate. Fortunately, a muscular and courageous international organisation is prepared to step in where […]