The FTSE 100 closed at its lowest value for three years yesterday. What interests me though is the pattern the chart displays: this shows the index from 1985 onwards:
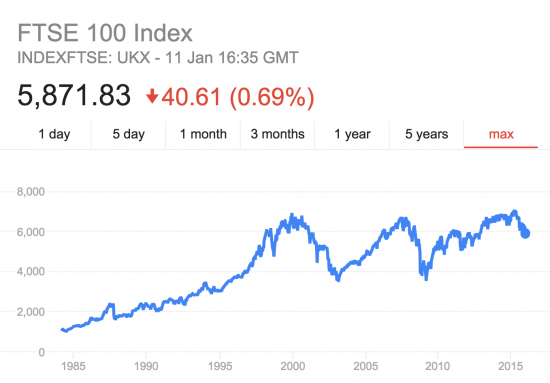
There have only been three occasions with serious downturns: 2000, 2008 and now.
The 2000 downturn did not preface a recession although the steps taken to prevent one did, in part, create the environment for 2008.
2008 was the start of the Great Financial Crash.
And now?
My opinion that this looks serious and that the time for radical, new and necessary alternative economic policies will arrive very soon looks increasingly appropriate. I sincerely hope people are beginning to think about how to do People's QE in practice. We are going to need it. That's because, as Larry Elliott and many others have now pointed out, there is nothing left anyone else knows to do this time round.
Thanks for reading this post.
You can share this post on social media of your choice by clicking these icons:
You can subscribe to this blog's daily email here.
And if you would like to support this blog you can, here:


The rush for door has started at RBS….
http://www.theguardian.com/business/2016/jan/12/sell-everything-ahead-of-stock-market-crash-say-rbs-economists
They may be right
The only problem with following the financial markets and their commentators is that there are always hidden agenda’s in everything that they say. For a market to operate there must be buyers and sellers, so it is either a good time to buy (on the dip) or a good time to sell (on the risk of further dips) depending on your analysis of the macro and micro environments.
Sadly when private investors are advised to do something, you can be fairly certain that the institutions have an ulterior motive and plan to do the opposite. The commodities markets are undoubtedly going to get a further kicking from the drop in demand from China, but other markets will be beneficiaries of those cheaper commodities, which may explain why there has been no widespread panic so far despite a few days of sharp correction in some sectors.
RBS warns of catclysmic year, says ‘sell everything and get out of the markets’. That should cause some wobbles.
http://www.theguardian.com/business/2016/jan/12/sell-everything-ahead-of-stock-market-crash-say-rbs-economists
I’d interpret the graph much differently. The first peak/trough was caused by the Tech crash which was based on a bubble in tech stocks. The second peak trough was a response to the financial crash. I emphasise the word response. While markets falls might well preface real world recessions, they tend not to cause them (eg. 1987 is a good example of this).
Personally I wouldn’t infer anything from the FTSE 100 to the british economy as it has an extremely high concentration of oil/mining stocks and/or which are stocks more generally that engage in only small amounts economic activity within the UK (eg. think Rio Tinto and BHP Biliton). A much better indicator of the UK economy is the FTSE mid 250 which appears to be in much better health (click max on the graph):
https://www.google.co.uk/webhp?sourceid=chrome-instant&ion=1&espv=2&ie=UTF-8#q=ftse%20250
I agree the FRSE does not matter per se: it is just a gambling measure
BUT it reflects sentiment. And sentiment matters enormously
And it is very bearish right now
With good reason – the emerging market threat is accurately reflected in the index
Meanwhile, the rentiers are doing very nicely out of the UK’s utility quasi-monopolies. That’s £1bn of our hard earned money gone to financial institutions, many based outside of this country, for the privilege of providing us with a basic essential of life.
And a massive share price gain for them as well – what a surprise!
http://www.independent.co.uk/news/uk/home-news/a6808386.html