As the Guardian notes this morning (and the length of the extract is important given the importance of the issue):
The number of households struggling with problem debt grew by a quarter between 2012 and last year, as stagnating wages forced a growing number to borrow to get by, according to the TUC.
By 2014, 3.2 million families were spending at least 25% of their gross monthly pay on servicing unsecured debts, the definition of problem debt. The figure for 2012 was 2.5 million, according to research commissioned by the TUC and Unison.
Young people, the self-employed and low-income families recorded the biggest increases in debt.
The report said 1.6m households were spending 40% of their gross income on repaying non-housing debts. Of those, 1.1 million were earned less than £30,000 a year.
This is not chance. As I have explained on the blog, time and again, if the Chancellor is to reduce his borrowing (which effectively means he wants to increase his savings) then someone else has to spend instead. That is a simple accounting fact that cannot be avoided.
So, George Osborne has effectively been forcing households to borrow, by holding their real earnings constant, by cutting benefits and letting some key aspects of inflation occur. They have reduced their saving as a result as this chart from the Office for Budget Responsibility shows:
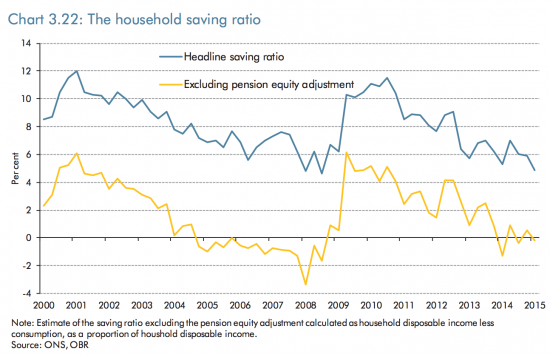
A reduction in saving means that overall many will have borrowed more. And this is the plan, as this chart from the same source shows:
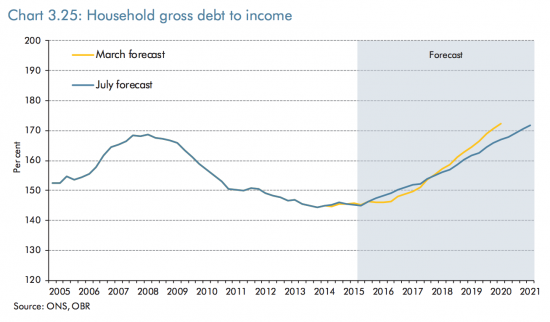
George Osborne is planning that households should go into considerably more debt so that the government can reduce their debt. It can be stated as simply and directly as that: this is the explanation of his plan to reduce the government deficit. He is simply shifting it to 0thers.
It is also the inevitable consequence of his trying to achieve that goal through austerity that will mean that there will be only limited real income growth at best, and unevenly spread at that.
In that case the misery that the TUC reveals resulting from debt burdens that households can hardly manage is not by accident, it is created by design, and it is meant to get worse.
This is the real debt crisis in this country.
If you want to know why we need a different economic approach this is one, very good, explanation.
Thanks for reading this post.
You can share this post on social media of your choice by clicking these icons:
You can subscribe to this blog's daily email here.
And if you would like to support this blog you can, here:


Chart 3.25 Household gross debt to income is the source I quote if anyone starts banging on about public debt.
This chart is the one that we should care about – private debt levels. Somewhere in that blue forecast section is our next recession if we continue on the path we are on.
The definition of madness springs to mind…
This is a very good point. That chart should be the corner-stone of an attack on the Tories by Labour.
It should be on front of EVERY policy document which Labour will publish.
Private debt is the problem, not government debt.
‘Private debt is the problem, not government debt.’
Correct and with our current balance of trade position, deficit spending is the way to reduce the levels of private debt.
Remove government spending or increase tax levels and the bubble bursts. Again.
You suggest that the reduction of public borrowing must be offset by increased household borrowing but, surely, the net saving (or net borrowing) of the business sector, the foreign (rest of the world) sector, the household sector and the public sector must all balance to precisely zero. The two big imbalances here are the rest of the world (through the trade deficit) and the government. The only way in which the public sector deficit can therefore be significantly reduced is by a reduction in the trade deficit.
And by trade investing
Buty pushing household borrowing up is also part of the plan
“The point of their paper is to argue that housing policy in Australia has largely been captured by sectional interests. In particular, they highlight the way in which right wing think tanks have peddled ideologically preferred policy solutions branded as “research”
“Gurran and Phibbs argue that a number of the policy capture and lobbying practices they observe in Australia were consciously imported from the UK”
http://www.alexsarchives.org/2015/08/policy-capture-busy-work-and-the-housing-problem/
Where have I heard all this before…..
Hello; G Osborne:
Chancellor to the rich.
“The average UK household will owe close to £10,000 in debts such as personal loans, credit cards and overdrafts by the end of 2016, which is a new high in cash terms, a report has found.
Total outstanding non-mortgage borrowing grew by nearly £20bn or 9% in 2014, to reach £239bn, marking the fastest rate of growth in a decade, according to the report from PwC, Precious Plastic: How Britons Fell Back in Love With Borrowing” (Grauniad).
No real political explanation is being given here and politicians to their eternal shame do not explain it-the fact is we have has flatlining wages since 1975 with the flatlining being ‘supplemented’ by the banking system ‘renting’ out the money (at high interest) that should have been ‘due’ in wages and this combined with housing bubble after bubble -as Richard says, it is a choice being paraded as metaphysical necessity-Corbyn has, at least opened a chink for a bit of light to get through.
Whenever you cut public spending or try to cut the deficit or the national debt, you simply move the debt from the public sector to consumers. That has almost always happened.
Incidentally, if Corbyn was to become PM, I hope that one of the first things on his aganda is to ban the legalised loan-sharkery that is Wonga, Quick Quid and the rest of them.
I find it despicable that they are even allowed to trade as there sole raison detre is to prey on vulnerable people.
I don’t suppose that Tim Worstofall will be blogging on this one.
Presumably therefore, the Chancellor is seeking to increase inequality for the benefit of the already well heeled.
Yes
Council tax overtakes credit cards as the most common debt problem for British households as thousands struggle to meet basic expenses:
http://www.thisismoney.co.uk/money/bills/article-2955558/Council-tax-overtakes-credit-cards-common-debt-problem-says-Citizens-Advice.html
If you believe this story, and I have my doubts, there’s been quite an increase in personal indebtedness in Jersey in the last 5 years
http://jerseyeveningpost.com/debt
Aldridge,
I think a neo-liberal gremlin got into your hyperlink.
It won’t let me in.
I read the source report and the methodologies of the 2012 data is different from the 2014 data. The authors do try and control for this. But the picture is more complex than the monstrously biased Guardian make out.
For example:
“In 2012, 53 % of households reported consumer debts or student loans, but we estimate that this has since reduced to 48% in 2014”. They also note that this is lower than it was pre-crash in 07/08 after 10+ years of unbroken growth.
As for those with low debt to income (DTI) levels they note:
“The proportion of debtor households with a DTI ratio of less than 10% has reduced by 8%”
But at very high debt ratios, those in difficulty are now in even greater difficulty.
If you could make a bet, then this will feed into higher personal bankruptcy statistics soon for those at the extreme end, but middle Britain is doing all right.
Baxter,
I might be talking to myself here, but the ONS does quarterly data on insolvencies, IVAs, and bankruptcies
https://www.gov.uk/government/uploads/system/uploads/attachment_data/file/448858/Q2_2015_statistics_release_-_web.pdf
They say things like
For personal insolvency ‘lowest level since Q3 2005’
Individual Voluntary Arrangements ‘lowest level since Q1 2006’
For this to be consistent with the TUC reporting an increase in really acute debt problems between 2012-2014, there must be a long lead time for it to reflect in official figures.
Perhaps the TUC have made an error in controlling their data ( underpinning it is a lot of offline survey data up to 2012, but all data collected online in 2014 ), or there’s another explanation.
Or perhaps people just struggle on
Or come to informal arrangements?
I am sorry – but to presume high levels of unsecured debt result in big rises in insolvency seems like an assumption to far to me
Either that, or there maybe a perfectly good explanation for the anomaly that Ivan is referring to and just requires a bit of investigation.
The impression that I get from talking to people face to face is that they are all struggling with some form of debt at the moment as their wages have either decreased or not kept up (most of the people I speak to are public sector workers).
Money – or problems with money – are a major source of shame in modern British society – I know of only one person who has ever taken the personal insolvency route which was after a relationship breakdown. I understand that in America, declaring personal insolvency is more of a norm. A recent article I read somewhere said (if I remember correctly) that around 60% of American personal insolvencies were caused by medical bills.
So it does not follow that that lower rates of insolvency in Britain match up with the harsh reality of people’s circumstance because people are too embarrassed to declare themselves as so – especially in a society driven by conspicuous consumption as we are now.
It all adds up to lot of unnecessary suffering compounded by a Government who have used the underpaid in the private sector to cheer on further reductions in public sector pay to level down wages – when in fact it would be better for the people in both sectors and the economy in general to level wages up.